
JPDA stands for Java Platform Debugger Architecture. It’s a multi-layered debugging architecture which enables a tool developer to easily and effectively develop a debugger application which will run across platform, VM implementations and JDK versions.
Note: This discussion is for Java SE 5.0!
Architecture
JPDA consists of two interfaces (JVMTI and JDI), a protocol (JDWP) and two software components which tie them together (back-end and front-end). For the sake of simplicity JDWP is referred as an interface only.
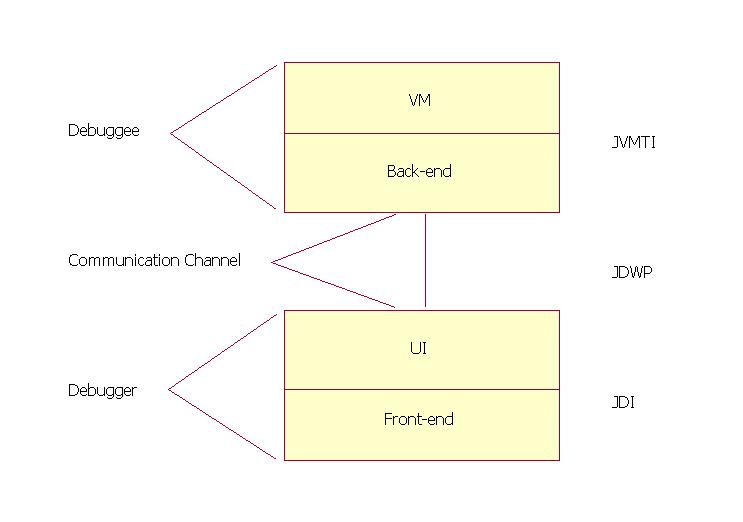
Debuggee
- The debuggee is the process being debugged; it consists of the (java) application being debugged, the VM running the application and the back-end of the debugger.
- The back-end of the debugger is responsible for communicating requests from the debugger front-end to the debuggee VM and for communicating the response to these requests (including desired events) to the front-end. The back-end communicates with the front-end over a communications channel using the Java Debug Wire Protocol (JDWP). The back-end communicates with the debuggee VM using the Java Virtual Machine Tool Interface (JVMTI).
- The communications channel is the link between the front and back ends of the debugger. It consists of two mechanisms: a connector and a transport.
- A connector is a JDI object that is the means by which a connection is established between the front and back-ends. JPDA defines three types of connectors:
- Listening connectors: The front-end listens for an incoming connection from the back-end
- Attaching connectors: The front-end attaches to an already running back-end.
- Launching connectors: The front-end actually launches the java process that will run the debuggee code and the back-end.
- A transport is the underlying mechanism used to move bits between the front-end and the back-end. The transport mechanism used is unspecified; possible mechanisms include: sockets, serial lines, and shared memory. However, the format and semantics of the serialized bit-stream flowing over the channel is specified by the Java Debug Wire Protocol (JDWP).
- The debugger front-end implements the high-level Java Debug Interface (JDI). The front-end uses the information from the low-level Java Debug Wire Protocol (JDWP) and gives to UI to display in user understandable and acceptable format.
Interfaces
Java Virtual Machine Tool Interface (JVMTI)
A native interface implemented by the VM. Defines the services a VM must provide for debugging. Includes requests for information (e.g. current stack frame), actions (e.g. set a breakpoint), and notification (e.g. when a breakpoint has been hit).
Java Debug Wire Protocol (JDWP)
Defines the format of information and requests transferred between the debuggee process and the debugger front-end. It does not define the transport mechanism (e.g. socket, serial line, shared memory etc). The specification of the protocol allows the debuggee and debugger front-end to run under separate VM implementations and/or on separate platforms.
Java Debug Interface (JDI)
A 100% Java interface implemented by the front-end. Defines information and requests at a user code level. While debugger implementers could directly use the Java Debug Wire Protocol (JDWP) or Java Virtual Machine Tool Interface (JVMTI), this interface greatly facilitates the integration of debugging capabilities into development environments.
How it works
Each interface provides are two types of activities: requests and events. Requests originate on the debugger side and include queries for information, setting of state changes in the remote VM/application, and setting of debugging state. Events originate on the debuggee side and denote change of state in the remote VM/application.
Example of request
- A user clicks on a local variable in a stack view in an IDE, requesting its value. The IDE uses the JDI to get the value; in particular it calls the getValue method on the stack frame.
E.g. stackFrame.getValue(localVariable).
Where stackFrame is a com.sun.jdi.StackFrame and localVariable is a com.sun.jdi.LocalVariable. - The front-end then sends this query over a communications channel (let's say a socket) to the back-end running in the debuggee process. It sends it by formatting it into a byte stream in accordance with the JDWP. In particular, it sends a GetValues command (byte value: 1) in the StackFrame command set (byte value: 16), followed by the thread ID, frame ID, etc.
- The back-end deciphers the byte-stream and sends the query off to the VM through the JVMTI. In particular, let's say the requested value is an integer, the following JVMTI function call is made:
error = jvmti->GetLocalInt(frame, slot, &intValue); - The back-end sends back across the socket, a response packet, which will include the value of intValue, and which will be formatted according to JDWP.
- The front-end deciphers the response packet and returns the value as the value of the getValue method call. The IDE then displays the value.
- The virtual machine sends an event (say break point occurred) across the JVMTI interface. In particular, it calls the event handling function passing the breakpoint.
- The back-end has set the event handling function to be:
static void Breakpoint(jvmtiEnv *jvmti_env, JNIEnv* jni_env, jthread thread, jmethodID method, jlocation location) { ... }
This back-end function starts a chain of activity which filters the event to see if it is interesting, queues it, and sends it across the socket in the JDWP format defined for breakpoint events. - The front-end decodes and processes the event, eventually generating a JDI event. In particular, the JDI event is exposing it as a com.sun.tools.jdi.event.BreakpointEvent. The IDE then gets the event by removing it from the event queue.
E.g. eventQueue.remove()
Where eventQueue is a com.sun.jdi.event.EventQueue. - The IDE will probably update its displays by making many query calls across the JDI.
- In the reference implementation of JPDA by Sun , JVMTI is implemented by the Java HotSpot VM and the client is the reference implementation of the back-end, supplied as a native shared library (jdwp.so, jdwp.dll), which is shipped with the JDK; which implement JVWP.
- The reference implementation of the back-end (above) provides the debuggee side of JPDA architecture, and the reference implementation of the front-end (a Java programming language component of the JDK, located in tools.jar and jdb ) provides the debugger side; which implements JDI.
- Start a program which will listen for debug requests using socket as transport on port 8000. Use jdb to connect and debug it.
C:\> java -agentlib:jdwp=transport=dt_socket,server=y,address=8000,suspend=y Hello Listening for transport dt_socket at address: 8000
C:\> jdb -connect com.sun.jdi.SocketAttach:hostname=localhost,port=8000
Set uncaught java.lang.Throwable
Set deferred uncaught java.lang.Throwable
Initializing jdb ...
> VM Started: No frames on the current call stack main[1] - Start a program which will listen for debug requests using shared memory as transport. Use jdb to connect and debug it.
C:\> java -agentlib:jdwp=transport=dt_shmem,server=y,address=mymem,suspend=y Hello Listening for transport dt_shmem at address: mymem
C:\> jdb -attach mymem Set uncaught java.lang.Throwable
Set deferred uncaught java.lang.Throwable
Initializing jdb ...
VM Started: > No frames on the current call stack main[1] - Launch a program using jdb and debug it.
C:\> jdb Hello Initializing jdb ... >
http://java.sun.com/products/jpda/doc/index.html
http://java.sun.com/products/jpda/

No comments:
Post a Comment